AgEvidence Provides Data on Regenerative Agriculture in Priority Foodscapes
Data tool visualizes over 39,000 data points on regenerative agriculture practices in the United States and Kenya.
For decades, scientists have studied the link between agriculture practices and the impact of those practices on food production and the environment. That knowledge is crucial for planning efforts to increase the sustainability of agriculture, yet most of the data are not readily accessible to practitioners because academic papers sit behind paywalls of peer-reviewed journals. AgEvidence enables anyone to access this body of research to support decision making and practice to advance sustainable agriculture.
AgEvidence is a database of over 39,000 data points from over 450 peer-reviewed research papers published around two focal areas: corn-soy production in the United States Midwest and diverse cropping systems throughout Kenya. Kenya and the US are global priority regions for The Nature Conservancy’s work on agriculture. AgEvidence was developed in these regions to spur learnings among practitioners and advance our strategy on regenerative food systems.
Interview with Stephen Wood, Ph.D.
Learn how to access and explore the research data and curated insights in AgEvidence.
Listen to the PodcastUsing AgEvidence to Advance Conservation by Understanding Benefits and Trade-offs
Visualization analytics enable users to easily navigate and interpret these data and explore regionally-specific practices. “Regenerative agriculture is not a one-size fits all management approach. That’s why we wanted users to be able to quickly assess the impact of winter rye cover crops on nitrate leaching in the US Midwest or intercropped maize-bean on soil fertility in Kenya,” said Lesley Atwood, Ph.D., Agriculture & Climate Scientist at TNC. “By featuring regionally-specific practices our users also have an opportunity to learn about regenerative practices practiced elsewhere, which we hope encourages more efforts to trial and adapt practices to new geographies.”
For users looking for quick answers to important questions, AgEvidence offers curated insights that use the data to address the relationship between regenerative agriculture practices and impacts to the environment specific to the US Midwest and Kenya. For instance, “Which practices best improve water quality?” or “What are the impacts of common cover crop use?” Users seeking to go beyond the curated insights can create their own, in-depth custom views of the data. A map of all of the studies allows users to filter the data for cropping systems that are of particular interest, and draws attention to geographies with little data where more studies could be conducted. (Watch this tutorial video on how the navigate the AgEvidence dashboard.)
“Because there’s so much science on this topic, different people and organizations can have different literature they refer to, which can lead to different conclusions about the evidence,” said Stephen Wood, Ph.D., Senior Scientist for Agriculture and Food Systems at TNC. “With AgEvidence, we set out to build a comprehensive and easy-to-access data platform allowing for greater alignment among groups about the state of the evidence.”
Some key insights from AgEvidence are:
U.S. Midwest
- Evidence shows that no-till leads to increased carbon storage in surface soils and lower nitrous oxide emissions.
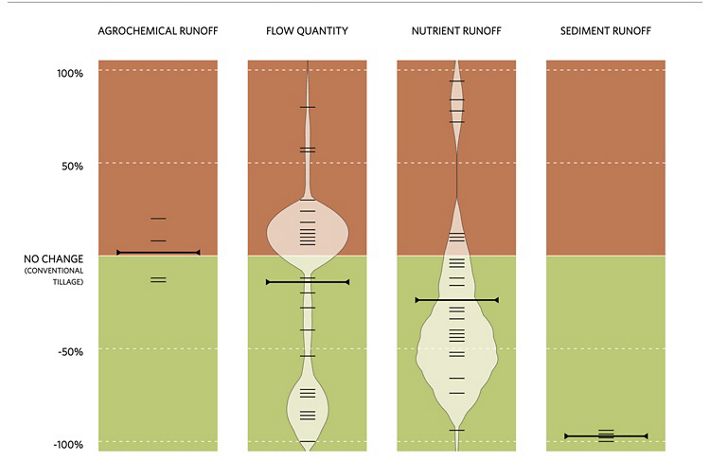
- Both reduced tillage and cover crops benefit water quality.
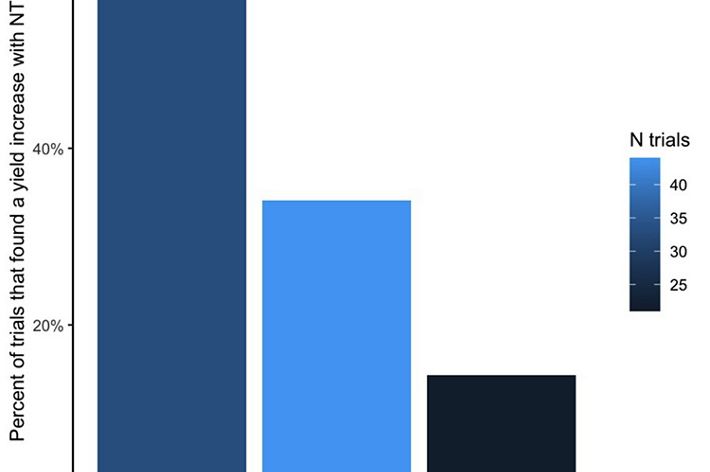
- Targeted fertilizer management and reduced tillage benefit crop yields.
- The long-term impacts of cover crops are difficult to assess because most of the studies in the database are from less than five years.
Kenya
- Intercropping reduces weed pressures and improves crop yields.
- No-tillage and organic soil amendments benefit crop health and productivity.
- Organic soil amendments lead to increased soil carbon, but is also associated with increased nitrogen emissions.
Going Deeper with AgEvidence Data
For those interested in going beyond the statistical capabilities of the tool, raw data can be exported for formal scientific analyses. For instance, Emma Fuller, director of sustainability science at Granular, wanted to explore in more depth the relationship between tillage and corn yields.
“Reviewing the data table in AgEvidence of the interaction between tillage and corn yields, it seemed like some of the biggest differences in treatment effect had baseline yields that looked on the lower end of what we observe in the field,” Fuller said. “Pulling out the data and grouping into yield bins—indeed it does seem like there’s an interaction between baseline yields and tillage effect.” This highlights an opportunity for further research.
AgEvidence was made possible by support from the Science for Nature and People Partnership, Craig and Susan McCaw Foundation, Nestlé Purina, Walmart.org, the Foundation for Food and Agriculture Research and Amazon Web Services.


